
8 Production Management Tools Every Business Needs | Wotech Electronics
Vũ Khôi
Tác giả tại Wotech Electronics Blog
8 Production Management Tools Every Business Needs
Vũ Khôi
Author at Wotech Electronics Blog
For manufacturing companies, production management plays an extremely important role, directly determining a company's revenue, profit, and reputation in the market. In today's article, SimERP will help you gain a deeper understanding of the production management tools available today.
The Production Management Process
Grasping these processes to steer a production operation requires not only professional expertise but also forecasting and observation skills. Typically, a production management process consists of the following stages:
Market research and assessing the company's production capability

Before starting production, a business needs to know which industry to focus on, how competitive that industry is, whether the company has enough resources to compete, and whether demand in the industry is high or low. This is the step that sets the direction and influences the company's production activities over a long period, so it requires managers to make highly precise and thorough determinations.
Planning material inbound and outbound
At this stage, managers need to carefully calculate maximum and minimum inventory thresholds to ensure that production runs continuously and that materials are not wasted.
Managing each stage
Monitoring and supervising the production stages gives managers a solid basis for carrying out the next steps. At the same time, it ensures seriousness and adherence to the process in the company's production activities.
Quality control
The product determines everything about the production process — it is what will be delivered into the hands of consumers, and it decides the company's reputation and value. For this reason, the product quality management step plays a very important role, requiring thorough and complete inspection and reporting.
Product pricing

The cost of a product is based not only on material costs, machine depreciation, and labor costs, but also on competitors' price levels. That is why managers need to research carefully before launching a product to market.
Post-production management
After launching a product to market, managers will still have to receive feedback and bug reports from customers. Prompt, policy-compliant warranty service and objective responses are also factors that elevate the company's value.
The 7 Production Management Tools
During production, many problems can arise. If you know how to manage quality effectively, anomalies, defects, or errors occurring during production can be minimized, delivering excellent results and quality for the company's products. To achieve this, business managers often apply the 7 quality control tools in production.
The origin of the 7 production management tools
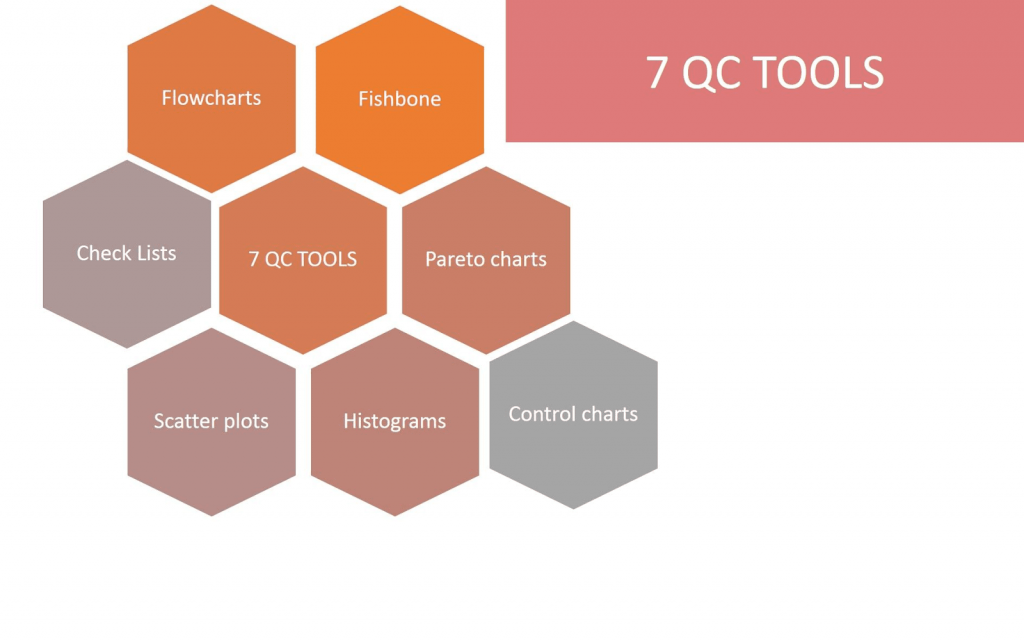
The 7 production management tools were developed in Japan in the period after World War II, when Japanese companies were facing many difficulties and challenges. To overcome these difficulties and remedy weaknesses in their production activities, the Japanese Union of Scientists and Engineers decided to build a system of statistical tools for use in quality management.
The creation of this toolkit provided tremendous support for statistical work and the efficient management of a company's core activities, quickly resolving quality management problems that commonly occur in production. Through this, the 7 production management tools were developed and widely adopted in many countries, not just Japan — especially in European countries. The 7 production management tools are:
-
Check Sheet: A control form.
-
Charts: Graphs.
-
Cause & Effect Diagram: Fishbone diagram.
-
Pareto Chart: Pareto diagram.
-
Histogram: Frequency distribution diagram.
-
Scatter Diagram: Scatter plot.
-
Control Chart: Control diagram.
Of the 7 production management tools above, the Check Sheet was the earliest to be applied. To better understand these 7 production quality management tools, let's dive into the specific information shared below!
The Check Sheet tool: The control form
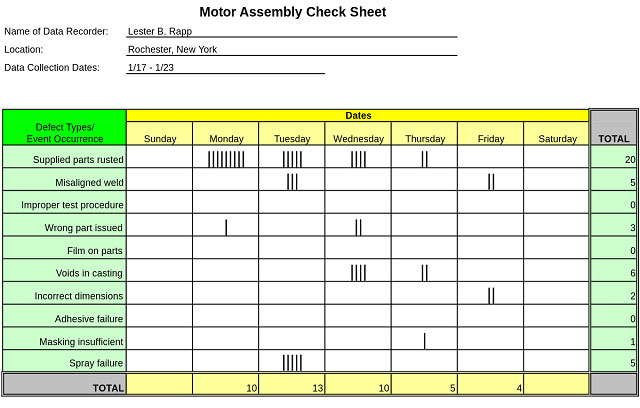
The Check Sheet is considered the simplest method of record-keeping, helping businesses compile the necessary information and data and accurately determine the priority order of events. This tool allows managers to objectively track trends or development patterns; it can take the form of a record of activities from the past to the present, making them easy to control.
The Check Sheet is a method commonly used to:
-
Check how the figures for a given item are distributed during the production process.
-
Conduct inspections and confirm work.
-
Check and identify the root causes of defects and errors in goods or products during production.
-
Check the types of defects in goods or products, and inspect the exact locations where defects commonly occur.
Through control using the Check Sheet, a company's tracking becomes clear and scientific, organized by time sequence or by specific location. This is also an important input dataset for the Pareto Chart — a focusing diagram that helps companies precisely track problems that commonly occur in production, such as hazardous waste collected per working hour, or the number of equipment maintenance sessions per week.
The Charts tool: Graphs
Charts is a tool that uses graphs — a way of representing the relationships between figures or quantities through visual drawings — helping managers easily observe and evaluate how the data changes over time or across specific periods.
By using Charts to visualize data, a business can more easily grasp the problems it is facing.
The Charts tool can take many forms, such as bar charts, pie charts, line charts, radar (spider) charts, or Gantt charts. Depending on the problem and the type of data being represented, the business will use the appropriate chart format, making it most convenient to observe and evaluate the issues the business is facing.
The Cause & Effect Diagram tool: The fishbone diagram
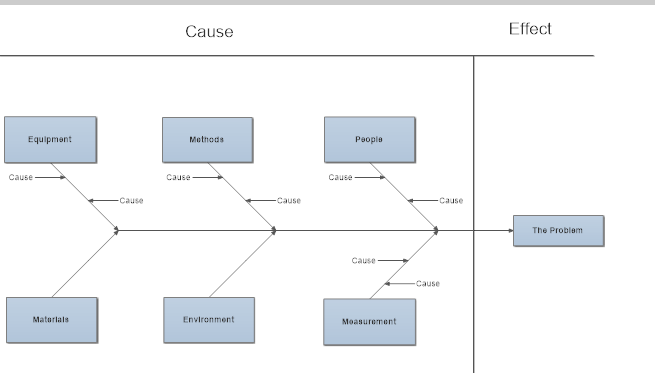
The Cause & Effect Diagram is a fishbone-shaped tool used to compile a list of causes that may lead to a certain result, consequence, or outcome. This diagram was first developed at the University of Tokyo in 1953, led by professor Kaoru Ishikawa. He used the Cause & Effect Diagram to show the engineers at Kawasaki Steel how various factors are linked together when arranged in a specific way. This is precisely why the Cause & Effect Diagram is also known as the Ishikawa diagram or the fishbone diagram.
Businesses that apply the Cause & Effect Diagram management tool will quickly identify the causes of the problems they are facing. Based on this, managers and business administrators can propose specific measures for remediation or prevention, thereby ensuring the quality of work and achieving the best results in the company's production and business operations.
The fishbone diagram is widely used to search for causes and investigate defects encountered in production. With this quality management tool, a business can prevent and study the hidden hazards that could harm its production activities. At the same time, managers will understand the systematic relationships involved and be able to compile a list of potential causes, classify them, and propose specific measures.
The Pareto Chart tool
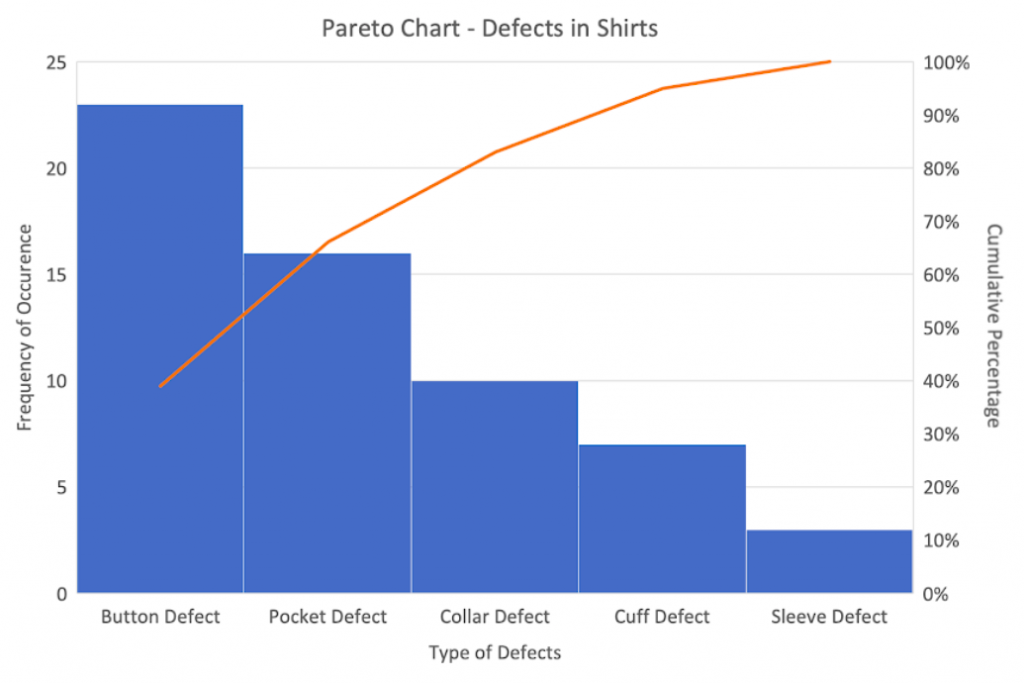
The Pareto Chart is used by business administrators to classify causes and assess the significance, importance, and impact of each on the products the business creates. This helps the company know which causes should be addressed first, given their level and potential for serious impact on the product.
The Pareto Chart production management tool helps managers break down causes in detail by importance, identifying which causes are most critical so priorities for resolution can be set. Through the Pareto Chart, managers can evaluate the effectiveness of improvements, thereby reducing the causes of defects or faulty products during production.
In addition, the Pareto Chart shows the number and proportion of errors occurring during production, which allows the business and its managers to know the exact figures and take specific corrective measures.
The Histogram tool: The frequency distribution diagram
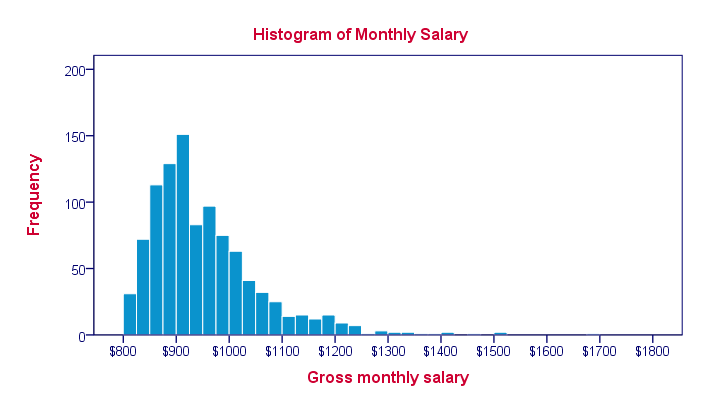
The Histogram — a frequency distribution diagram — is a fairly simple type of bar chart that shows the frequency of an event through data points aggregated on the chart.
Using this chart, companies and business managers can conveniently track the distribution of product parameters or parameters that appear during production. From the compiled statistics, managers can assess whether the process has fully met production requirements. The Histogram shows the frequency of occurrence of issues collected and compiled via the Check Sheet.
Applying the Histogram quality management tool helps businesses prevent problems effectively before they occur in production or business operations.
The Scatter Diagram tool: The scatter plot
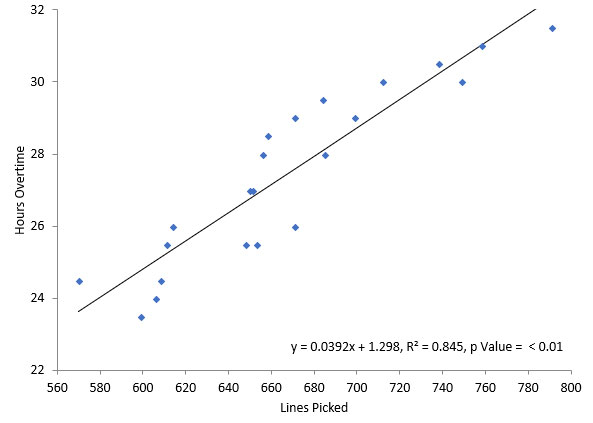
The Scatter Diagram production management tool — the scatter plot — is a method of representing data graphically. Typically, a scatter plot shows and indicates the relationship between two specific factors identified and defined by the company.
Using the scatter plot helps business administrators solve problems and determine optimal conditions through quantitative analysis of the causal relationship between two factors, via the variables those factors exhibit.
From the values shown on the scatter plot, the business can see how one factor depends on another and the degree of that dependence. The denser the scatter, the greater the mutual influence — and vice versa.
The Control Chart tool: The control diagram
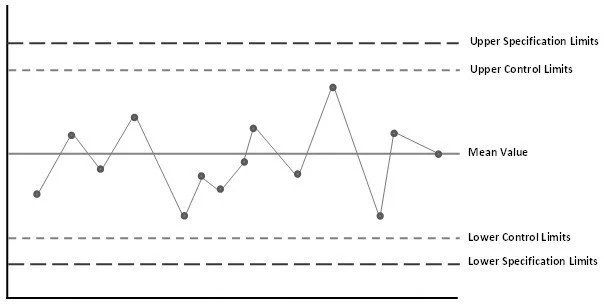
The Control Chart production management tool — the control diagram — is a type of chart with limit lines calculated using statistical methods. It uses data to track how parameters fluctuate: how they change across each operational process and product quality characteristic, in order to control all signs of abnormality when the limit lines on the chart trend downward or upward.
This tool is typically used for the purpose of quickly detecting abnormal situations occurring in a company's business or production. Based on this, managers can promptly make adjustments and take appropriate corrective measures without affecting the company's business performance.
Conclusion
We hope the information shared above about quality management tools has helped you understand them better and apply them appropriately in your production process, delivering optimal results for your business. If you have any questions, please leave a comment below this article so SimERP can help you resolve them quickly.
Related articles
Bài viết liên quan

25 tháng 10, 2026 · 3 phut doc
2024年网页设计趋势预测如何? | Wotech Electronics
关于 2024 年网页设计趋势——步入 2024 年,年初正是我们为新事物预留时间的时刻。这也非常适合设计师群体唤醒我们内心的"艺术之魂"。闲话不多说,快来和 Markdao 一起浏览 2024 年的 UX/UI 设计趋势吧,说不定您就能为自己接下来的网页设计项目"迸发"出一个绝妙的点子呢!

25 tháng 10, 2026 · 1 phut doc
什么是网站(Website)?网站的详细定义及其带来的商业价值
什么是网站(https://www.markdao.com.vn/blog/website-la-gi)——这个问题或许已经无需定义,因为在如今这个信息时代,网站对每一家企业而言都是不可或缺的组成部分。正是网站帮助用户更近距离地接触企业所提供的产品和服务,从而提升经营效益。此外,要在当今竞争如此激烈的环境中求发展,网站是一个重要因素,它将带你走向品牌与销量上的双重成功。

25 tháng 10, 2026 · 1 phut doc
什么是SEO标准网站?一场"打赢"Google SEO标准的战役 | Wotech Electronics
99%的用户在购买前会先搜索信息,73%的用户只会访问排名前10的网站,并认定它们是值得信赖的品牌……在数字营销爆发的时代,这些数字有力地印证了SEO标准网站的重要性。然而,许多人对什么是SEO标准网站(https://www.markdao.com.vn/blog/huong-dan-toi-uu-seo-website-chuan-seo-on-page)仍然相当模糊,并未真正理解。达到SE…