The 3 AM Incident: Combining Metrics, Logs, and Traces to Find a Connection Pool Exhaustion
Vũ Khôi
Tác giả tại Wotech Electronics Blog
The 3 AM Incident: Combining Metrics, Logs, and Traces to Find a Connection Pool Exhaustion
PagerDuty woke the on-call team at 3 AM: P99 latency on the checkout API had jumped from 180ms to 3.2 seconds, and 0.4% of requests were returning 504 errors. This article retells the investigation shared by Lữ Minh Khương — based on the video "3AM Observability Crash Course (A True Story)" from the pouria channel — following the "Wolf Fencing" approach: moving from Metrics to Logs to Distributed Tracing to find the root cause, a connection leak that drained the PostgreSQL Connection Pool. All figures below come from that shared post, which reenacts an incident investigation.
Quick answer: The root cause was a Connection Leak that exhausted the Inventory Service's Connection Pool — not CPU overload or a traffic spike. Metrics in Grafana proved Order Service was healthy but waiting on a downstream service. Logs narrowed the suspect down to the call to Inventory Service. Distributed Tracing showed that acquiring a connection from PostgreSQL took 2,962ms while the SQL query itself took 4ms. The 3 AM workaround was restarting the service to reset the Connection Pool; the permanent fix is reviewing code so every connection is closed and enabling leak detection in HikariCP.
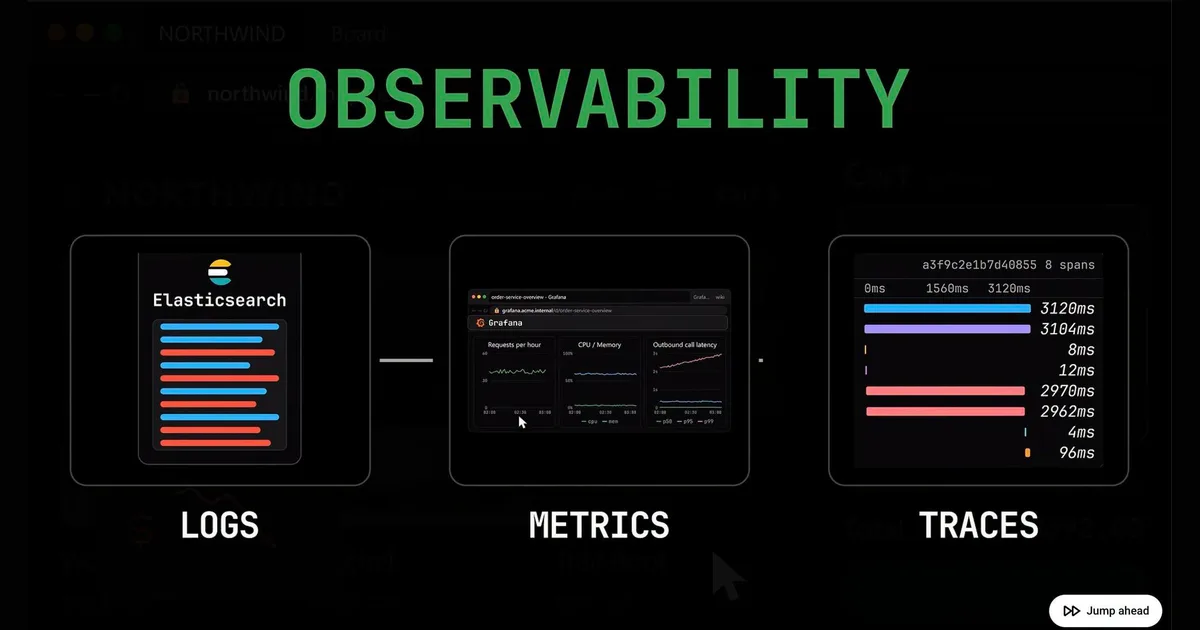
Observability is the ability to understand a system's internal state from the data it produces, usually through three pillars: Metrics (aggregated numbers), Logs (event records), and Traces (the journey of an individual request). Connection Pool Exhaustion is the state where the pool of database connections is fully used up, forcing later requests to queue until they time out.
What happened at 3 AM?
The story opens with a critical PagerDuty alert: P99 latency on POST /checkout at the API Gateway had exceeded 2 seconds continuously for 5 minutes. P99 is the 99th percentile — 99% of requests are faster than this mark, only 1% slower. A checkout request normally took about 180ms, but during the incident it spiked to 3.2 seconds, and 0.4% of requests failed with a 504 Gateway Timeout.

In the author's judgment, anyone working in backend knows that a 504 at the API Gateway means the Gateway itself is not broken — it is standing around waiting for some downstream service to respond too slowly. The problem is that the system has dozens of microservices calling each other: the browser goes through a CDN to the API gateway, the gateway forwards to Order Service, and Order Service calls auth, catalog, inventory, and payment (via Stripe), backed by Redis and PostgreSQL. Without a method for narrowing the search, the on-call engineer drowns among dozens of services and mountains of data.

What is "Wolf Fencing" thinking, and why does it work?
The video recalls a classic debugging mindset called "Wolf Fencing." To find one wolf in the vast state of Alaska, you build a fence cutting the state in half, listen for the howl to learn which half it is in, then keep halving that region until you catch it. Handling a production incident works the same way: use observability tools to build one fence at a time, shrinking the search area instead of guessing service by service.

The key point the author stresses is the order of the fences: start with the cheapest overall view (Metrics), then dig into individual requests (Logs), and only use the most expensive, most detailed tool (Traces) once the scope is narrow enough. Reversing the order — diving straight into individual request traces before knowing which service has the problem — wastes a great deal of time while the system is on fire.
What do Metrics say — and what can they not say?
The first fence is checking Metrics in Grafana, with data scraped every 15 seconds from each service's HTTP endpoints into Prometheus's time series database. Opening the Order Service dashboard, the author looks at three basic metric types to rule out causes.
First is http_requests_total, a Counter — a value that only increases over time. Its growth-rate chart shows incoming traffic staying flat at about 40 requests per hour, meaning the system was not under a DDoS attack or a traffic spike.
Next are the CPU and Memory charts, Gauges — values that can rise and fall. Order Service's CPU hovered around 4% and RAM stayed flat, proving the service itself was idle, neither resource-starved nor stuck in garbage collection.
The real clue sits in the third chart: Outbound Call Latency from Order Service, measured with a Histogram — response times bucketed into predefined ranges. Here the P50 stayed at a healthy 20ms, but P99 shot up to 2.9 seconds and had been quietly climbing since 9 PM. That confirms Order Service was perfectly healthy, but while processing it had to call a series of other services and was being held up by one of them.

But this is where Metrics run out of road. As the author puts it, Metrics are by nature aggregated numbers — they cannot point at an individual request and say which service it was slow calling. To tighten the fence one more notch, you must move to Logs.
How do Logs tighten the net?
Log lines in the system are written with a severity level (INFO, WARN, ERROR) in JSON format — Structured Logging — so they can be filtered by field. A log collector like Filebeat listens to every service's stdout/stderr stream and pushes the logs to Elasticsearch for indexing. From Grafana, filtering directly on the Elasticsearch data source with service = order-service, route = /checkout, and duration >= 2000ms exposes every request that was left hanging. Opening one record that took 2,970ms shows the culprit slowing it down was the outbound call to Inventory Service.
The usual next step is to take the Trace ID — the unique trace identifier generated by the API Gateway, attached to the HTTP header, and passed through all downstream services — and search for it in Inventory Service's logs. But a very real-world situation occurs: searching that Trace ID in Inventory Service's logs returns nothing at all, simply because when that service was written, the developer forgot to configure pushing the Trace ID into the log context (for example MDC — Mapped Diagnostic Context in Java/SLF4J). The author tells this detail as a practical reminder: a logging system only works when the Trace ID is synchronized from the Gateway layer all the way down to the Database.
What do Traces reveal?
When logs run dry, the final tool to expose the problem is Distributed Tracing. Looking up that same Trace ID in the tracing tool reveals the request's entire lifecycle as a timeline of Spans — each Span representing one unit of work in one service. The timeline of the 3,120ms request paints an extremely clear picture: the request passes through the API Gateway and is proxied into Order Service; Order Service calls Auth Service to authenticate the user in just 8ms; then Order Service calls Inventory Service and is stuck there for 2,970ms.
The most valuable part of Tracing, in the author's view, comes when expanding the child Spans inside Inventory Service: the SQL query itself took exactly 4ms, but the Span right before it, acquire connection — requesting a database connection — consumed 2,962ms. In other words, the database was not slow; what was slow was waiting to be given a connection to talk to the database.
Checking the Span Attributes at that connection-acquisition step exposes the root cause: the application uses a Connection Pool to PostgreSQL configured with max_pool_size = 20. At that moment, all 20 connections were in_use (100% used) and 7 other requests were queued waiting for a connection to be released.
Why did the Connection Pool run dry?
This is the classic Connection Pool Exhaustion bug, caused by a Connection Leak. Somewhere in the database code, a flow borrowed a connection from the pool but, when it finished — or when an Exception was thrown — forgot to call close() to return the connection to the pool. Every time execution entered that faulty branch, the pool permanently lost one connection, until it hit the ceiling of 20 and later requests had to wait until they timed out. This also explains why P99 had been quietly climbing since 9 PM: the pool was leaking gradually, not collapsing suddenly.
The ending of the video is funny but very realistic: because this Inventory Service was written by someone who had left more than a year earlier and nobody dared to change code at 3 AM, the on-call team's workaround was to restart the pod/service to wipe the Connection Pool clean and start over. Restarting does not fix the bug — it only resets the countdown to the next pool exhaustion.
Apply it now: the investigation procedure and the permanent-fix checklist
The narrowing-down procedure in the shared post can be applied directly to your next on-call incident:
- Read the alert carefully before opening any dashboard. Note the trigger condition (for example, P99 > 2s for 5 minutes), the current value versus normal (3.2s versus 180ms), the error rate, and the named service. A good alert already contains half the diagnosis.
- Open the named service's Metrics and rule things out in order. Check traffic (Counter) to rule out a spike, check CPU/Memory (Gauge) to rule out resource exhaustion, then look at outbound latency by percentile (Histogram): a healthy P50 with a spiking P99 means the service is fine but waiting on another service.
- Move to Logs with a narrow filter. Filter by service, route, and a duration threshold (for example,
duration >= 2000ms), open one slow request, and see which outbound call consumes most of the time. - Take the Trace ID to Traces. Read the Span timeline, expand the child Spans of the slowest service, and read the Span Attributes — especially pool, queue, and wait-time attributes.
- Stop the bleeding first, fix the root cause after. Restore service with the safest measure (in this story, a restart), record all the evidence collected, and only change code when alert and with review.
For permanently fixing a Connection Leak, the author gives a checklist for Java/Spring Boot teams using HikariCP — and the general principles hold for other stacks too:
- Review every place that opens a connection manually and wrap it in a
try-with-resourcesblock so the connection is always closed, even when an Exception is thrown. - Manage the lifecycle of
@Transactionaltightly, avoiding holding a connection across an unnecessarily long transaction. - Enable
leakDetectionThresholdso the system automatically prints a stack trace warning as soon as a connection is held too long. - Make sure the Trace ID is pushed into the log context of every service, from the Gateway down to the Database, so Logs never run dry next time.
Three pillars, each answering a different question
| Pillar | The question it answers | Evidence in this incident | Limitation, in the author's view |
|---|---|---|---|
| Metrics (Prometheus/Grafana) | Is the system overloaded or is traffic spiking? | Flat traffic at 40 requests/hour, CPU at 4%, P50 20ms but P99 2.9 seconds | Only aggregated numbers — cannot point at which request or which service is slow |
| Logs (Filebeat/Elasticsearch) | Which specific slow request, and which call is it stuck on? | A 2,970ms record showing the call to Inventory Service was the culprit | Useless if a service forgot to push the Trace ID into its log context — as Inventory Service did here |
| Traces (Distributed Tracing) | Where did a request's time go, millisecond by millisecond? | The acquire connection span at 2,962ms versus SQL at 4ms; pool 20/20 in_use, 7 requests waiting |
The most detailed but also the most laborious — use it only after Metrics and Logs have narrowed the scope |
Frequently asked questions
1. What does P99 latency mean? P99 is the 99th percentile of response times: 99% of requests are faster than this mark, only 1% slower. In this incident, P50 stayed healthy (20ms) but P99 reached 2.9 seconds — most requests were still fast, but a small group was left hanging for a very long time, and that group produced the bad experience and the 504 errors.
2. If I see a 504 at the API Gateway, is the Gateway broken? According to the author, no. A 504 Gateway Timeout means the Gateway waited too long without receiving a response from a downstream service. The Gateway is only where the symptom shows; the cause sits in a service behind it — in this story, Inventory Service.
3. Why does restarting the service make the incident disappear temporarily? Because a restart wipes the Connection Pool clean and recreates it with all 20 connections free. But the leaking code is still there, so the pool will gradually drain again until the next exhaustion. Restarting is a workaround, not a fix.
4. What does leakDetectionThreshold in HikariCP do?
It is the connection-leak detection threshold: when a connection is held beyond the threshold without being returned to the pool, HikariCP automatically prints a stack trace warning, showing the development team exactly which code is holding the connection too long.
5. If my system has no Distributed Tracing yet, what do I investigate with? Still start with Metrics to rule out overload and traffic spikes, then use Logs filtered by service, route, and duration to find slow requests. But the shared post stresses one prerequisite: the Trace ID must be attached consistently to the logs of every service. Without that link, Logs run dry exactly when you need them most — which is why Tracing should be invested in before an incident happens, not after.
Source: a post by Lữ Minh Khương in the VGU Tech Alumni group (16/11/2026), summarizing and commenting on the video "3AM Observability Crash Course (A True Story)" from the YouTube channel pouria. All figures, service names, and investigation details in this article come from the simulated scenario in the video as retold by the post's author — they are not independently measured data from Wotech.
Bài viết liên quan

18 tháng 11, 2026 · 6 phut doc
FPT Software Chairwoman: US Clients No Longer Want to Pay by the Hour, Company Shifts to Outcome-Based Pricing
Artificial intelligence is forcing FPT Software to transform its traditional software outsourcing model: large clients in the US now apply 100% outcome-based payment, and the company expects the Time…

18 tháng 11, 2026 · 6 phut doc
Meta Expands Muse to Australia: The 6th Country, Real-Time Voice, and Local App Integrations
On 17/11/2026, Meta expanded Muse to Australia — the 6th officially supported country, just over 2 months after its US launch. According to a post by Hồ Hoàng Tiến (18/11/2026), the notable point is …

18 tháng 11, 2026 · 7 phut doc
AI Agent Costs Grow With the Square of Steps: 4 Layers to Cut Token Spend Before Switching to a Cheaper Model
You don't pay for answers — you pay for how many times you re-ask the same thing. That is the central argument of Hoang Viet AI in a post in the comailo group (18/11/2026): an agent running 40 steps,…